Trendcraft Weekly: 1 signal change, week of Oct 19
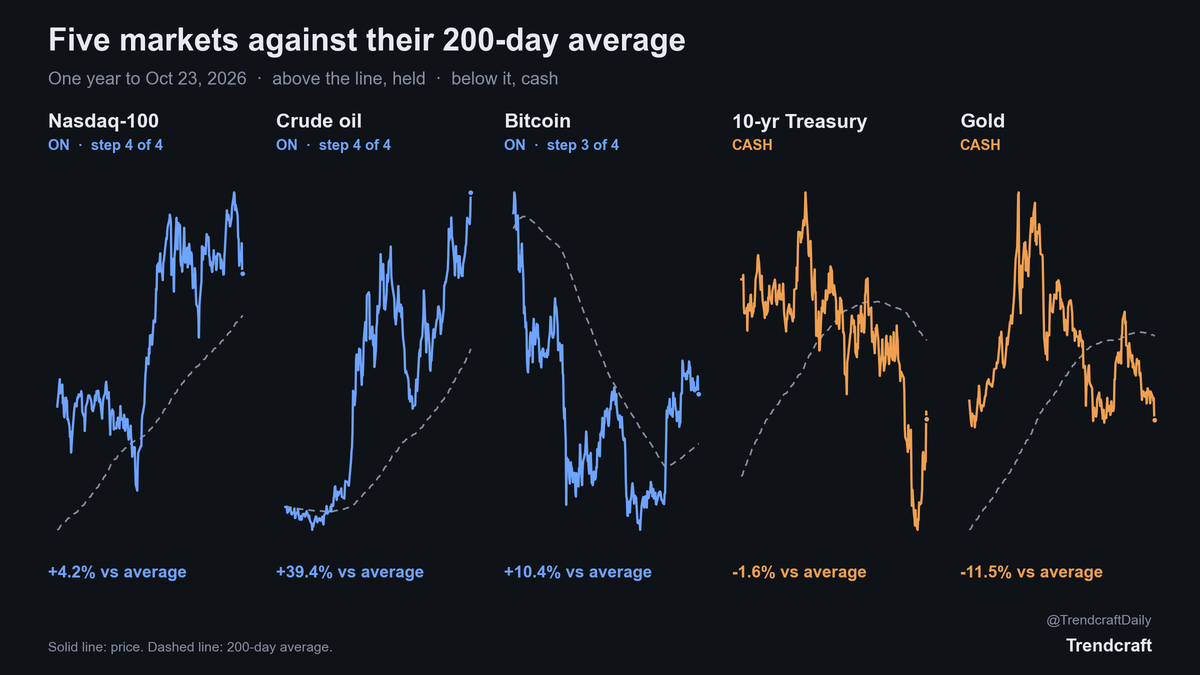
One signal change this week. Three of five markets are on going into next week.
| −1.2% Model, this week (hypothetical) | −1.2% Model, since Oct 19 (hypothetical) | 1 Signal changes |
New here? How the rules work: five markets, one 200-day rule, built in four steps.
What moved the board
Last week's test was whether the 10-year yield would climb back above 5.25% while oil stayed over $100. Half of it happened: oil stayed over $100, but the yield fell 11 basis points to 4.99%.
Two stories ran the week: oil and fresh doubt about AI spending.
December crude settled Friday at $103.44 a barrel, up 4.46% on the week. Brent, the global benchmark, hit its highest level since May after more Houthi attacks on Saudi energy and airport targets.
On Thursday, chip and AI stocks sold off. Meta fell 7% after reporting its first cash outflow in more than a decade and a plan for a new class of stock to fund AI spending. The Nasdaq composite dropped 2.6% that day, money moved into Treasuries, and the 10-year dipped below 5%. For the full week the Nasdaq-100 fell only 0.79% and the S&P 500 0.47%.
Gold took the worst of it. December gold settled at $4,010 an ounce, down 4.09%, after briefly trading under $4,000 for the first time since July. Traders cited oil. An energy-driven rise in inflation keeps the Fed leaning toward higher rates, and because gold pays no interest, higher rates make it more expensive to hold. Rate futures put the odds of a December hike at around 80%.
The tension to watch
Rate futures and the 10-year read the week two ways. Futures price a December hike because oil keeps inflation hot. The 10-year yield fell anyway, because a crack in the AI trade sends money looking for safety, and a weaker economy is what eventually ends a hiking cycle. Both can't be right. The Fed meets Oct. 27 and 28, expected to hold. If the Fed keeps a December hike on the table and the 10-year moves back above 5.10% while oil holds over $100, the inflation side is winning. If the yield keeps falling through the meeting, bonds are still betting the Fed won't need to.
What the rules did
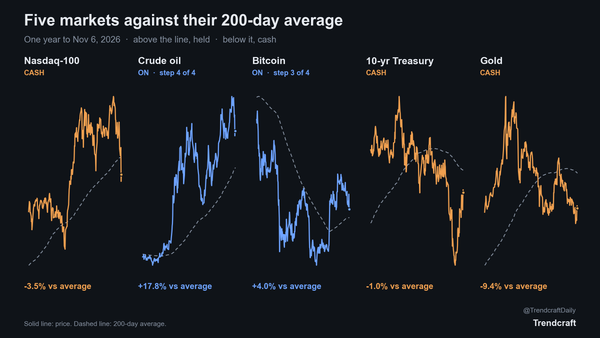
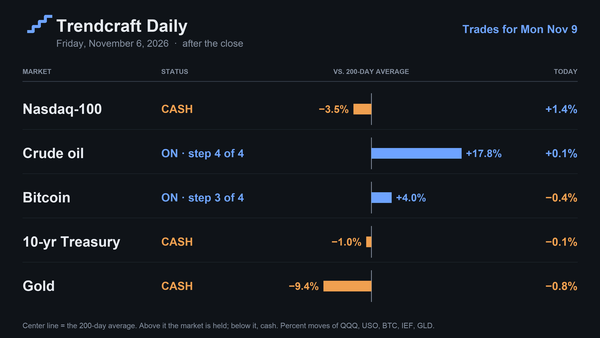
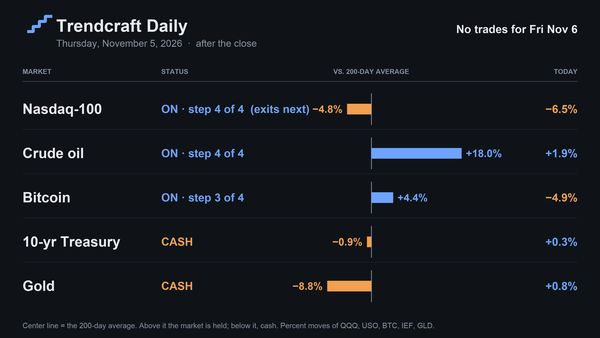
No market crossed its 200-day average, so nothing went on or off. The one change came Monday: oil's daily swings got wide enough that the rule cut it to 85% of its normal size, still at the fourth and final step. Sizing for volatility keeps a wilder market from carrying more risk than a calm one. Oil remains the strongest trend, 39.4% above its average. The Nasdaq-100 is on at step 4 and 4.2% above its average, down from 5.4% a week ago; a hard day triggers nothing, only a close below the line. Bitcoin is on at step 3, 10.4% above. Gold stays in cash, 11.5% below. The 10-year is in cash too, though the bond rally pulled it to 1.6% below its average, from 2.4%.
The record
Nasdaq took the most from the model this week; oil pulled the other way. The model portfolio was −1.2% this week and is −1.2% since the first issue on Oct 19 (margin version); the cash version was −1.2% and −1.2%.
Hypothetical: the published targets priced at each close from Oct 19, after modeled trading costs (half the bid-ask spread plus commission on every change) and margin interest at 5.0% a year on borrowed dollars, before taxes. It is a model, not an account. Every signal change is dated in the issue that announced it, so the record can be checked against what was published at the time.
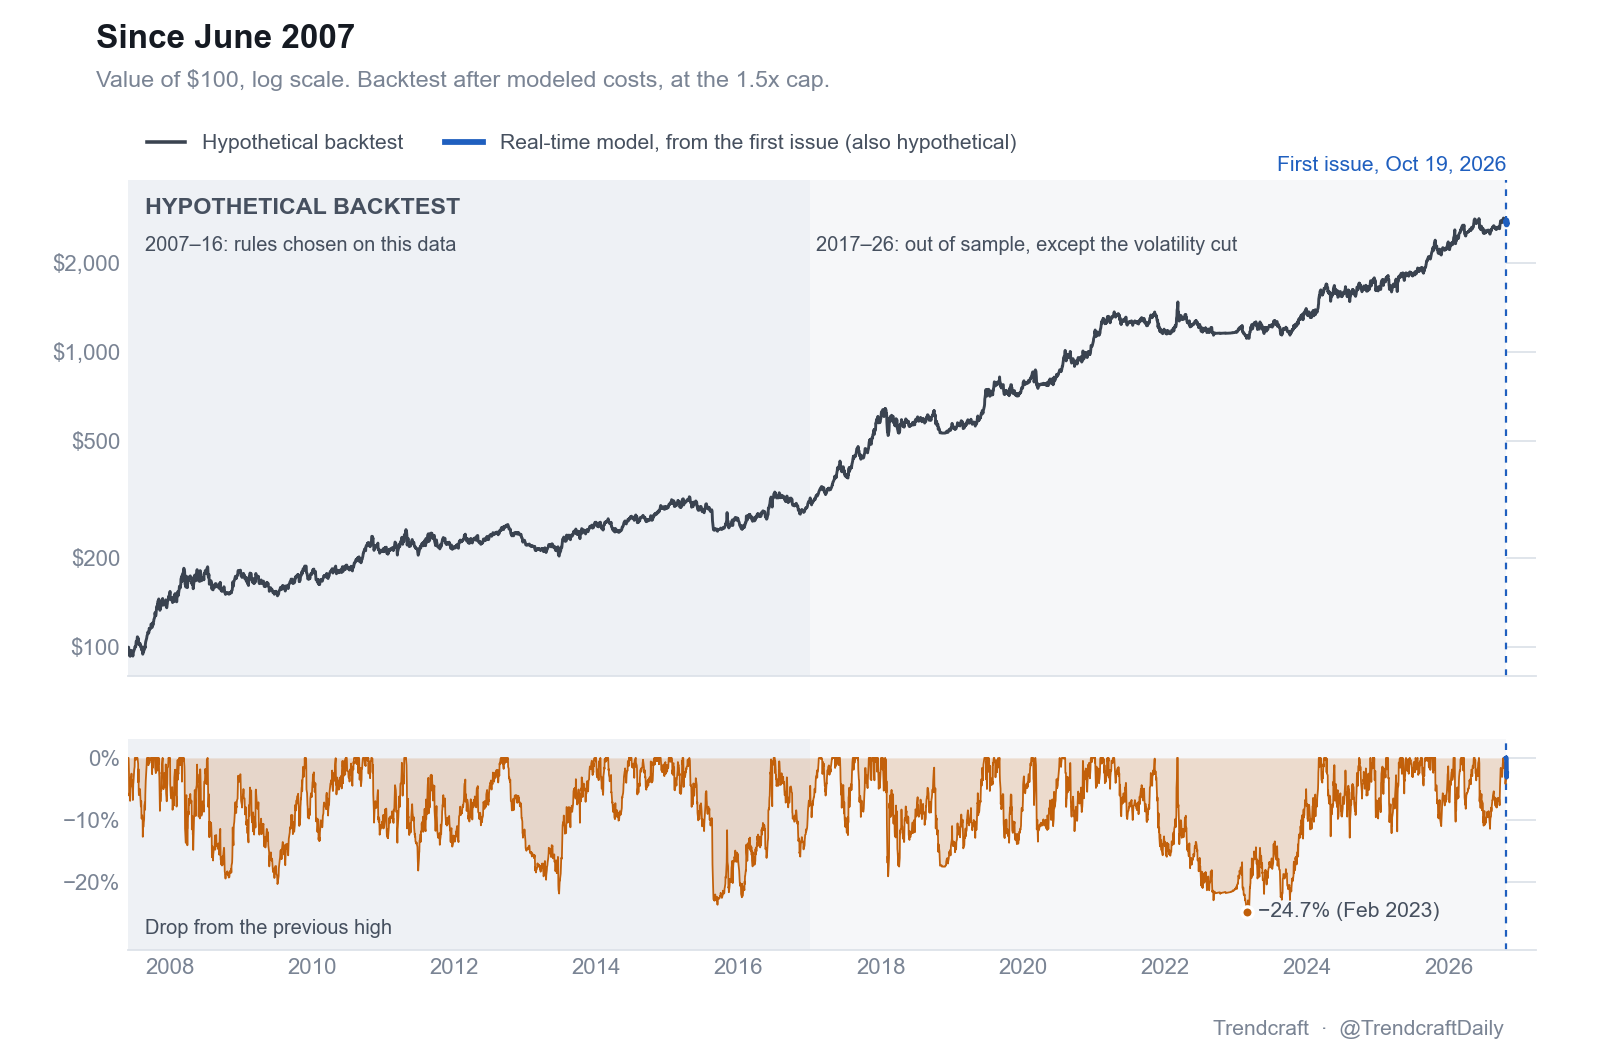
| Read this with the numbers. Hypothetical backtest, not actual trading: the same rules run over Jun 2007 to Oct 19, 2026 made 18.6% a year, with a worst drop of 24.7%. That splits into 12.5% a year for 2007-2016 and 24.9% a year from 2017, so the recent stretch ran about twice the earlier one. The rules were chosen on 2007-2016 data; the volatility cut was added in October 2026 after looking at the whole period, so it is not tested out of sample. Before each 2x fund existed, it is simulated from its underlying market. Figures are after modeled trading costs and margin interest, before taxes. The real-time model since Oct 19 is hypothetical too. Neither is an account, and neither guarantees future results. |
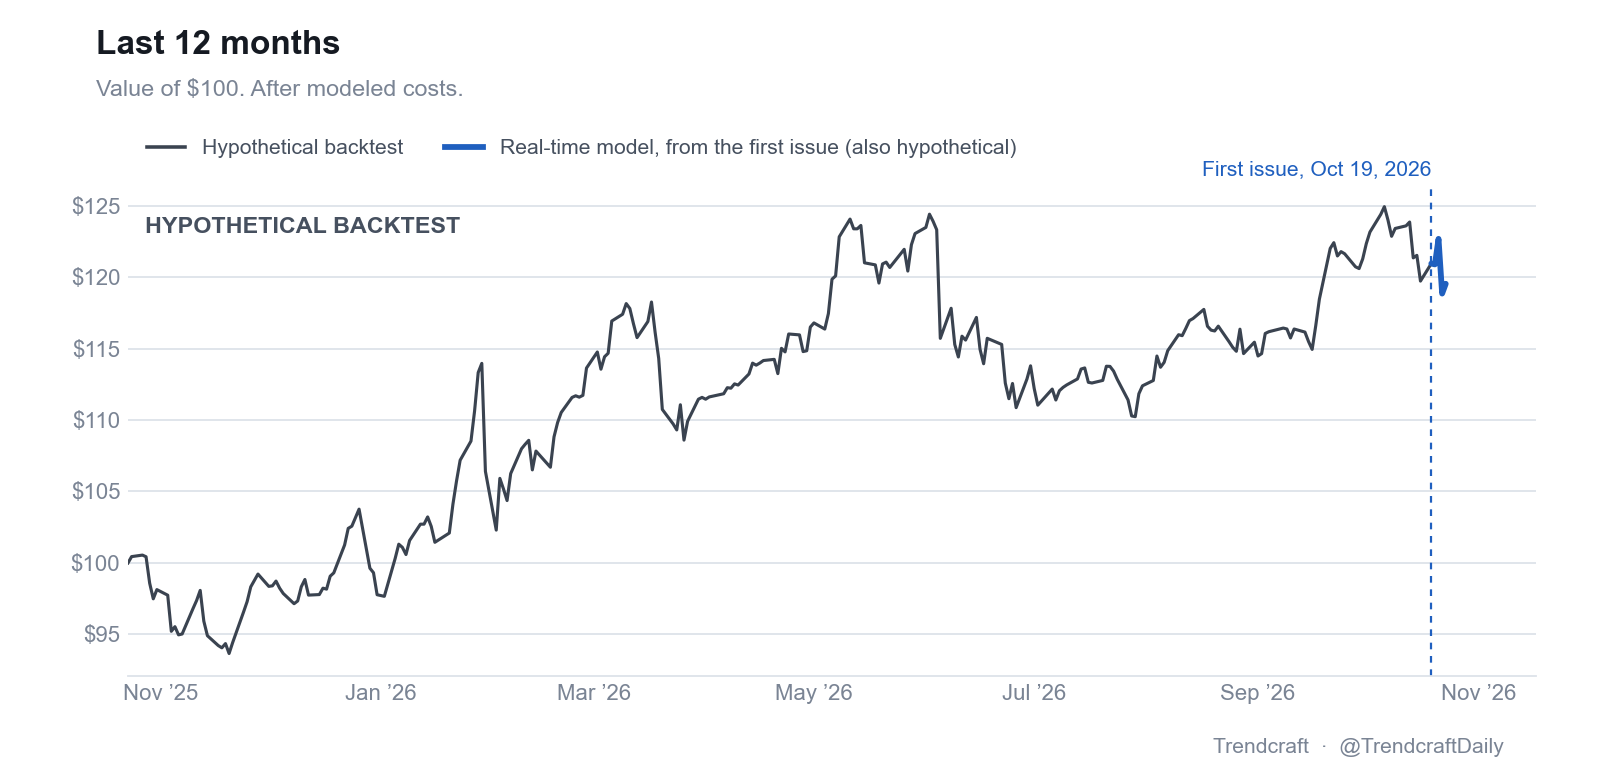
Real-time model by month (%)
| Year | Jan | Feb | Mar | Apr | May | Jun | Jul | Aug | Sep | Oct | Nov | Dec | Total |
|---|---|---|---|---|---|---|---|---|---|---|---|---|---|
| 2026 | −1.2 | −1.2* |
Hypothetical model, margin version, after modeled costs. * From the first issue, Oct 19.
Backtest returns by year (%)
| 2007 | 2008 | 2009 | 2010 | 2011 | 2012 | 2013 | 2014 | 2015 | 2016 |
|---|---|---|---|---|---|---|---|---|---|
| +48.6* | +20.5 | −1.5 | +20.8 | +2.6 | +3.9 | +16.6 | +11.4 | −8.7 | +14.7 |
| 2017 | 2018 | 2019 | 2020 | 2021 | 2022 | 2023 | 2024 | 2025 | 2026 |
| +87.6 | −4.1 | +35.2 | +47.7 | +5.4 | −0.4 | +16.7 | +18.1 | +38.1 | +23.7† |
Hypothetical backtest, $100,000 at the 1.5x cap, after modeled costs. Blue is a gain, orange a loss. * 2007 starts in June. † 2026 runs to Oct 19, where the backtest stops and the real-time model takes over. Every month since 2007 is on the Track record page.
The worst drops
| # | Depth | High | Low | Months down | Months to recover | Back to the high |
|---|---|---|---|---|---|---|
| 1 | −20.4% | Jan 2015 | Aug 2015 | 7 | 10 | Jun 2016 |
| 2 | −19.1% | Sep 2012 | Jun 2013 | 9 | 6 | Dec 2013 |
| 3 | −17.1% | Apr 2011 | Jun 2011 | 2 | 14 | Aug 2012 |
| 4 | −16.3% | Apr 2021 | Feb 2023 | 22 | 10 | Dec 2023 |
| 5 | −15.1% | Jun 2008 | Oct 2008 | 4 | 2 | Dec 2008 |
Hypothetical backtest: the five deepest falls from a month-end high, how long the fall took and how long the recovery took. Month-end values, so a drop that recovers inside a month doesn't show here: on daily closes the worst drop was −24.7% (Feb 24, 2023). The last month-end is Oct 19, 2026.
Best and worst stretches
| Period | Best | Worst | Worst ended | Average | Median | Lost money |
|---|---|---|---|---|---|---|
| 3 months | +36.7% | −20.0% | Aug 2015 | +4.8% | +4.3% | 35% |
| 1 year | +94.1% | −18.0% | Jan 2016 | +19.2% | +16.6% | 20% |
| 3 years | +157.5% | −2.6% | Sep 2015 | +63.1% | +50.1% | 2% |
| 5 years | +367.7% | +14.3% | Apr 2016 | +125.9% | +114.4% | 0% |
| 10 years | +896.3% | +210.4% | Dec 2018 | +433.7% | +422.5% | 0% |
Hypothetical backtest: every rolling window since May 2007. "Lost money" is the share of windows that ended below where they started. Same month-end basis.
What drove the backtest's last 12 months
| Crude oil | +20.3 pts | ||
| Nasdaq-100 | +7.5 pts | ||
| Gold | −0.2 pts | ||
| Bitcoin | −1.9 pts | ||
| 10-yr Treasury | −4.1 pts | ||
| Cash interest | +0.8 pts | ||
| Margin interest | −1.1 pts | ||
| Trading costs | −1.5 pts |
Each market's contribution, Oct 17, 2025 to Oct 19, 2026, in points of return; costs and interest are their own rows, and the rows add to the backtest's +19.8% for those 12 months. Hypothetical backtest.
The week in signals
| Close of | What happened | Traded |
|---|---|---|
| Mon Oct 19 | Oil cut size for volatility to 85% of normal, still at step 4. | Trade Tue |
| All week | Nasdaq, bitcoin held their steps; gold, the 10-year stayed in cash. | No trade |
Where the book stands
| Market | Step | Status |
|---|---|---|
| Nasdaq-100 | 4 of 4 | 4.2% above its average |
| Crude oil | 4 of 4 | 39.4% above its average |
| Bitcoin | 3 of 4 | 10.4% above its average, building |
| 10-yr Treasury | off | 1.6% below its average |
| Gold | off | 11.5% below its average |
Exact position sizes, entry and add levels, and same-day changes are in the daily edition.
Get the signals the evening they happen, free. The daily edition goes out after every close with the model portfolio (margin and cash versions), the signal board, and the price levels to watch. Turn it on in your account settings.
About this publication. Trendcraft is the same for every reader and is not personalized investment advice. The publisher does not manage, trade or access reader accounts, and trades any personal account holding the model's positions only after each issue is sent.
Risk. The model uses 2x leveraged ETFs and, in the margin version, borrowed money. Leveraged funds lose value in volatile, sideways markets, and a broker can sell positions without notice in a margin call. Losses can be large and fast. Model and hypothetical results are not actual trading and do not guarantee future results.
How this is made. Signal tables are generated by a fixed program from daily price data. Commentary is drafted with AI and reviewed and edited by the publisher.