Nasdaq goes to cash. Trades for Mon Nov 9.
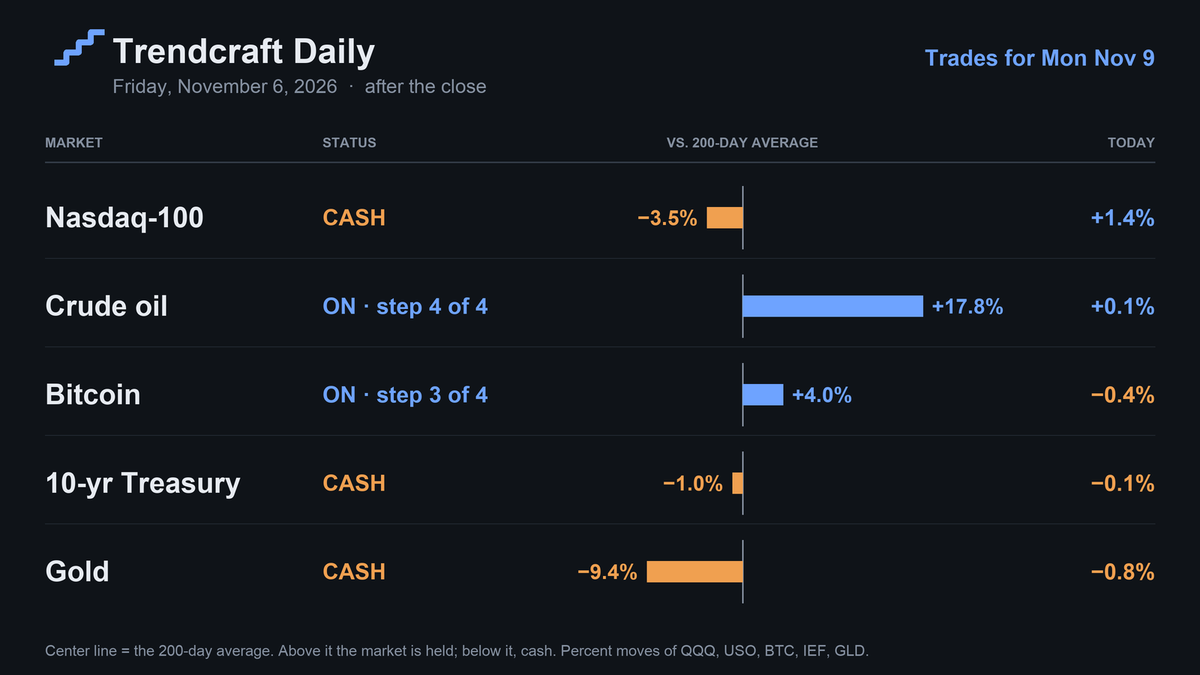
For Monday: Nasdaq goes to cash.
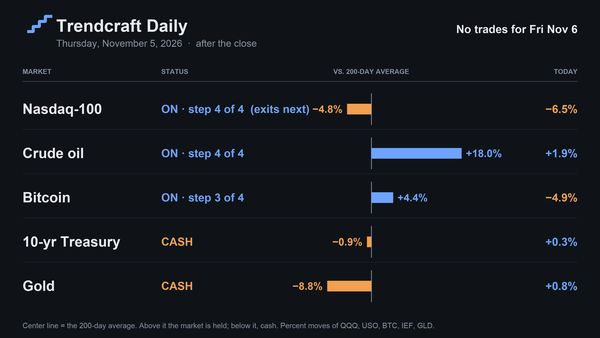
Today: Nasdaq +1.4%, oil +0.1%, bitcoin −0.4%, the 10-year −0.1%, gold −0.8%. The model portfolio is −11.5% since the first issue on Oct 19 (hypothetical, after modeled costs; track record).
What to do for Monday
- Nasdaq-100 (QLD): sell all of it (was 41.1%).
- No change: Crude oil (UCO) at 19.2% and Bitcoin (BITX) at 11.5%.
- In cash: the 10-year and gold.
Trade calculator: use it on the web (enter what you hold, it lists the trades), or download the spreadsheet, type in your cash and the shares you own, and it works out each buy and sell for your account.
Why
ExitNasdaq-100 (QLD). QQQ closed below its 200-day average in the previous session, which is the rule's signal to step aside. The whole position is sold and the money goes to cash until QQQ closes back above its average.
Your targets for Monday, Nov 9
| Fund | Market | Hold | Last issue | What to do | On a $10,000 account |
|---|---|---|---|---|---|
| UCO | Crude oil | 19.2% | 19.2% | Hold | $1,918 |
| BITX | Bitcoin | 11.5% | 11.5% | Hold | $1,146 |
| QLD | Nasdaq-100 | 0.0% | 41.1% | Sell all | $0 |
| UST | 10-yr Treasury | 0.0% | 0.0% | None | $0 |
| UGL | Gold | 0.0% | 0.0% | None | $0 |
| Cash | 69.4% | 28.3% | $6,935 |
Hold is the share of your account to keep in each fund, by dollar value, after the trades. The last column shows what that means on a $10,000 account; scale it to yours. The targets add up to less than 100% of the account, so nothing is borrowed and the margin and cash versions are the same today. At full size, each market gets fewer dollars the more it tends to swing, so each one adds about the same risk to the account.
How the rules work
Each market is either on or in cash. It's on while its price is above its average closing price of the last 200 trading days, and goes fully to cash when it closes below that average. Once on, it builds in four steps: it starts at a quarter of its full size and adds a quarter each time the price climbs another average daily range above where it started. The signals use the plain markets (QQQ, GLD, USO, IEF and bitcoin); the positions are held in 2x funds that move about twice as much each day. Full rules are on the Methodology page.
Signal board
| Market | Tracks | Vs. 200-day average | Steps | Next step |
|---|---|---|---|---|
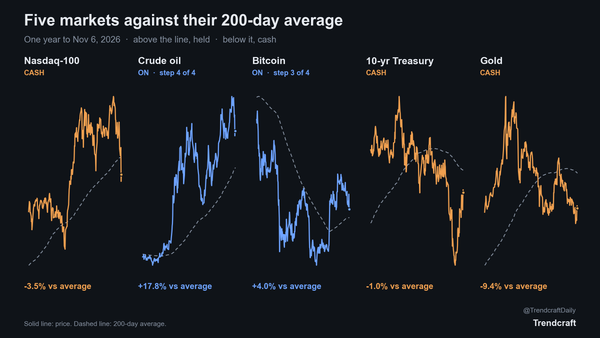
| Nasdaq-100 | QQQ | −3.5% | in cash | in cash |
| Gold | GLD | −9.4% | in cash | in cash |
| Crude oil | USO | +17.8% | 4 of 4 | all 4 in |
| 10-yr Treasury | IEF | −1.0% | in cash | in cash |
| Bitcoin | BTC | +4.0% | 3 of 4 | 14.3% higher |
What to watch
- Bitcoin is the closest to an exit, 4.0% above its average. A close about 4.0% lower moves it to cash.
- Bitcoin is 14.3% from step 4. A close about 14.3% higher adds step 4.
- Nasdaq is in cash, 3.5% below its average. A close about 3.7% higher starts a new entry.
- Gold is in cash, 9.4% below its average. A close about 10.3% higher starts a new entry.
- The 10-year is in cash, 1.0% below its average. A close about 1.0% higher starts a new entry.
How to use this letter
- When to trade: any time during Monday's session. The model's results assume the trades were made at today's close, which no reader can do, so your prices will differ a little. When the rules were tested, trading one day later made no meaningful difference to the results.
- When to change a holding: only when its target changes, or when it has drifted more than 5 percentage points away from its target. Otherwise leave it alone. Example: UCO's target is 19.2%. If a rally has grown it to 24.7% of your account, sell back down to 19.2%.
- Margin or cash: the margin version borrows to hold more than 100% of your account; the cash version holds the same mix without borrowing. If you don't use margin, follow the cash version. A margin account needs at least $2,000 under FINRA rules, and many brokers ask for more. Each broker also sets its own margin requirement for 2x funds, often higher than for ordinary stocks, so check yours. Today nothing is borrowed, so the two versions are the same.
- Your situation: this letter is the same for every reader. Your taxes, account size and how much loss you can live with are yours to weigh.
Past issues · Track record · Methodology
About this publication. Trendcraft is published after every U.S. market close. It is the same for every subscriber and is not personalized investment advice. The publisher does not manage, trade or access subscriber accounts.
Publisher's positions. The publisher follows the model's cash version with real money in two brokerage accounts and places those trades only after each issue is sent. The publisher never trades ahead of readers.
Risk. The model uses 2x leveraged ETFs and, in the margin version, borrowed money. Leveraged funds lose value in volatile, sideways markets, and a broker can sell positions without notice in a margin call. Losses can be large and fast. Model and hypothetical results are not actual trading and do not guarantee future results.