Oil and chips ran the week. The rules sat still.
The first Trendcraft Weekly: an oil shock, an eight-day chip selloff, and why the rules made no trades.
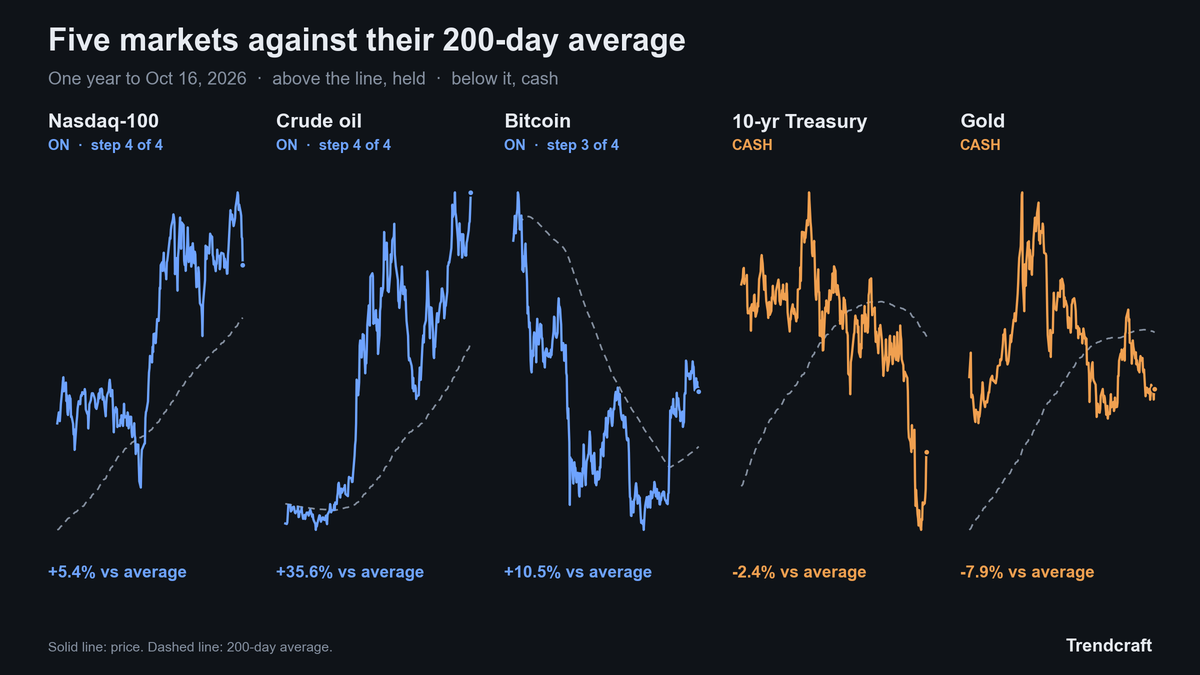
This week: no signal changes in five sessions. The live record starts Monday, Oct. 19.
Welcome to Trendcraft
This is the first issue. Five markets, one set of written rules: a market is held while it closes above its 200-day average and goes to cash when it closes below, and a position is built in four steps as the trend proves itself. The rules make the trades. This section is where I write the why. The full rules are on the Methodology page.
What moved the board
Two stories with no schedule ran the week: oil and chips.
Crude oil closed Friday at $101.41 a barrel, up 10.4% on the week. Early in the week Houthi forces struck Saudi Aramco's headquarters in Dhahran, the latest in a string of attacks on Saudi energy sites, and oil closed higher every day of the week. At the same time, a selloff in chipmakers stretched to eight sessions in a row, helped along by Broadcom's chief executive comparing some AI spending to casino gambling. The Nasdaq-100 fell 5.5% and the S&P 500 fell 2.0%. The VIX, Wall Street's fear gauge, went from 14.8 to 20.0.
The scheduled news said one thing and the bond market did another. Core consumer prices rose 0.3% in September against 0.2% expected, and producer prices jumped 1.3%. Hot inflation usually pushes yields up. Instead the 10-year Treasury yield fell from 5.24% to 5.10%, its biggest weekly drop since February, as money left AI stocks for Treasuries. Fed Chair Kevin Warsh declined on Friday to say whether the Fed raises rates at its Oct. 27 and 28 meeting.
The tension to watch: an oil shock pushes inflation up, and a cracking stock market pushes the Fed toward caution. Both can't win. Falling yields during hot inflation data say the bond market is betting on the second. If the 10-year climbs back above 5.25% while oil stays over $100, the inflation side is winning, and that is bad news for stocks and bonds at the same time.
What the rules did
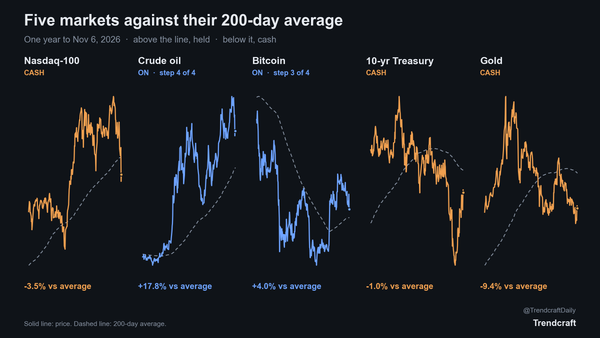
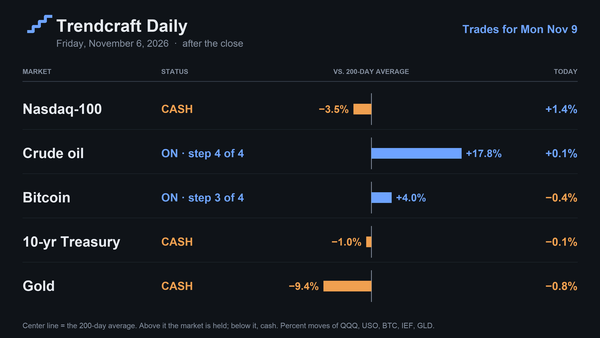
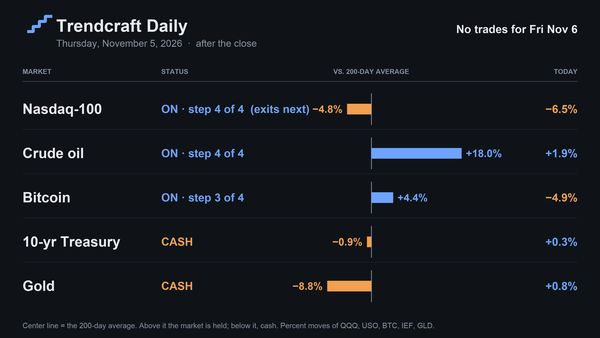
Nothing, and that's the point. No market crossed its 200-day average, so there were no trades. Oil is the book's strongest trend, at full size and 35.6% above its average. The Nasdaq-100 had a rough week and is still 5.4% above its average; the rule doesn't react to a bad week, only to a close below the line. Gold and the 10-year stay in cash. The bond rally helped the 10-year, but it is still 2.4% below its average.
The week in signals
| Close of | What happened | Traded |
|---|---|---|
| All week | Nasdaq, oil, bitcoin held their steps; gold, the 10-year stayed in cash. | No trade |
Where the book stands
| Market | Step | Status |
|---|---|---|
| Nasdaq-100 | 4 of 4 | 5.4% above its average |
| Crude oil | 4 of 4 | 35.6% above its average |
| Bitcoin | 3 of 4 | 10.5% above its average, building |
| 10-yr Treasury | off | 2.4% below its average |
| Gold | off | 7.9% below its average |
Exact position sizes, entry and add levels, and same-day changes go to paid subscribers in the daily edition.
The record
The live record starts with Monday's session, Oct. 19. From next week this section shows the model portfolio's result for the week and since launch, margin and cash versions, after trading costs and margin interest. Every signal change is dated in the issue that announced it, so the record can be checked against what was published at the time.
Get the signals the evening they happen. The daily edition goes out after every close with the model portfolio (margin and cash versions), the signal board, and the price levels to watch.
About this publication. Trendcraft is the same for every reader and is not personalized investment advice. The publisher does not manage, trade or access reader accounts, and trades any personal account holding the model's positions only after each issue is sent.
Risk. The model uses 2x leveraged ETFs and, in the margin version, borrowed money. Leveraged funds lose value in volatile, sideways markets, and a broker can sell positions without notice in a margin call. Losses can be large and fast. Model and hypothetical results are not actual trading and do not guarantee future results.
How this is made. Signal tables are generated by a fixed program from daily price data. Commentary is drafted with AI and reviewed and edited by the publisher.